Read a prevalence estimate with its population attached
How Many Men Are Colorblind? Read the Rate by Scope
Quick answer
A widely cited estimate is about one in twelve males with red-green color vision deficiency among populations with Northern European ancestry.
That is not a universal rate for all men or every type of color vision deficiency. Later reviews measured different populations and age groups, so read the source, condition, denominator, and year beside each figure before using it.
Do this now: check whether the estimate covers red-green deficiency or all color vision deficiency, and whether its participants match the group you mean.
Compare the estimates by scopeHow many men are colorblind depends on which group was studied
The phrase “one in twelve men” is useful only with a population label. MedlinePlus Genetics applies it to red-green color vision defects among populations with Northern European ancestry, and says the incidence is lower in almost all other populations studied. It is not a global count of men.

For the keyword wording percentage of men colorblind, look for the same scope details as you would for how many men are color blind. The wording changes; the population behind the estimate does not.
Compare the percentage of men who are color blind by source and denominator
The estimates below answer different questions. Each row keeps the source year, condition, geography or ancestry, and male denominator together.
| Source and year | Reported male estimate | Population and condition | What the estimate can answer |
|---|---|---|---|
| MedlinePlus Genetics, page updated 2015 | About 1 in 12 males | Red-green color vision defects among populations with Northern European ancestry. | A commonly cited ancestry-specific estimate; the source says rates are lower in almost all other populations studied. |
| PLOS ONE Africa review, published 2024 | 2.13% of African male participants; 95% confidence interval 1.73%–2.52% | Color vision deficiency in studies from Africa. The 16 included cross-sectional studies covered participants of any age and pooled 21,167 people across all groups. | A pooled estimate across varied study populations, not a count or census of adult men throughout Africa. The male estimate had substantial between-study heterogeneity (I² 72%). |
| Ophthalmology review, published 2025 | 4.38% of male participants; 95% confidence interval 3.93%–4.88% | Congenital color vision deficiency in general-population studies of children and adolescents worldwide. The review covered 56 studies in 21 countries. | A global estimate for boys and male adolescents in the included studies, not an estimate for adult men. |
The 2024 Africa review pooled studies with different populations and reported high heterogeneity. The 2025 review restricted its analysis to congenital deficiency in children and adolescents. Neither result should be averaged with the 2015 ancestry-specific figure as if all three used the same definition and denominator.
Use a male color blind percentage as a rate, not a headcount
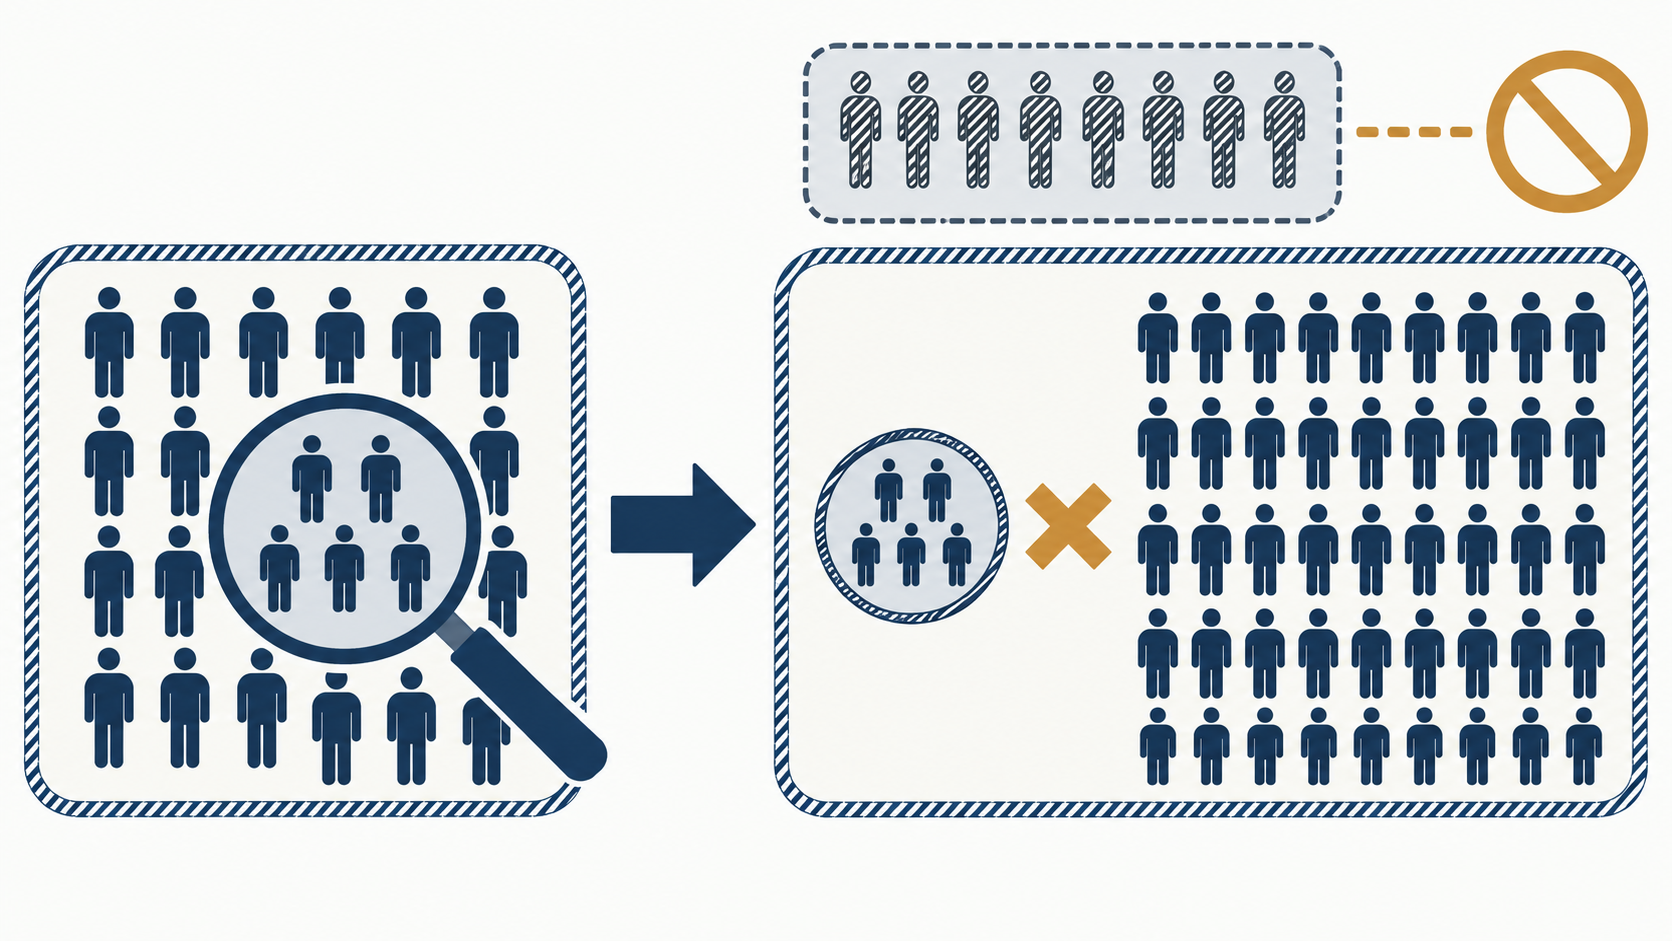
To estimate a count for a place, first match the rate to that place, the same age range, the same condition, and the same reference period. Then multiply that rate by the matching male population total. If the source covers a different cohort, report the result as a model with that mismatch stated; do not present it as a measured headcount.
Worked conversion: a child and adolescent estimate is not an adult count
The 2025 review’s 4.38% estimate for male children and adolescents is about one in twenty-three participants in those study groups. This conversion is 100 divided by 4.38, rounded to the nearest whole participant. It does not tell you how many adult men are colorblind, and it is not a current headcount for a country.
This calculation makes the denominator visible; it does not extend the review beyond its stated age group.
Checklist: what a percentage of men that are color blind should include
Before quoting a male color blind percentage, record these scope fields beside it:
- Condition: red-green defects, congenital deficiency, or color vision deficiency across the study’s included types.
- Population: ancestry or geography, age range, and whether the group is a sample or a population-wide estimate.
- Denominator: the male participants or residents represented by the rate.
- Date and uncertainty: publication or data period, plus a confidence interval or a stated limitation when available.
The source table above applies this checklist to each estimate. If one field is missing, report that it was not stated rather than filling it in from another source.
How common is color blindness across the whole population?
A male-only rate cannot be converted into the percentage of people who are color blind without a compatible estimate for the other groups and the population mix. The 2015, 2024, and 2025 figures in this guide use different populations or conditions, so combining them would produce a result their sources did not measure.
If your question is “how common is color blindness?” use a source that defines the whole population being counted. If your question is specifically how many men are colorblind compared with women, keep the male and female denominators separate and use rates measured under comparable definitions.
Frequently asked questions about how many men are colorblind
Is the percentage of men who are color blind the same everywhere?
No single rate applies to every population. The source-reviewed estimates differ by ancestry, geography, age range, and whether the study counts congenital or broader color vision deficiency.
Does the male estimate equal the percentage of people who are color blind?
No. One rate uses male participants as its denominator. A whole-population percentage needs a matching estimate and denominator for the entire population.
What should I do with a percentage of men that are color blind from an undated page?
Do not present it as a current measurement. State that the page does not give the estimate year, then prefer a source with a defined population and traceable date.