A historical U.S. rate, checked one conversion at a time
Color Blindness Statistics: Read a Historical Rate Correctly
Quick answer
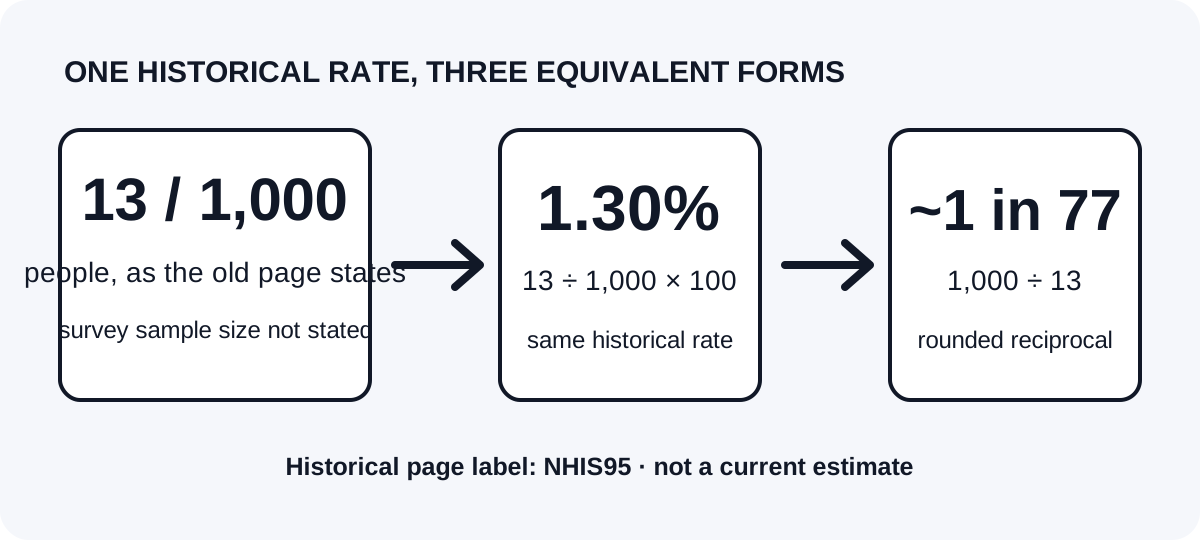
A historical U.S. prevalence page, last updated in 2011, labels its rate “13 per 1,000 people” and “NHIS95.” That is 1.30%, or about 1 in 77 people.
The same page prints “about 1 in 76” and “3.5 million people in the USA.” Those are approximate forms, not an exact match: the page does not state the survey sample size or the U.S. population base used for the count.
Use it only as a historical record attributed to that page. Do not quote its 3.5 million figure as a current count.
Check the conversionHow the 1995-labeled rate converts across four forms
The historical page labels its source statistic “13 per 1,000 — NHIS95.” The “95” appears to refer to 1995, but the survey report and respondent count are not included in the recovered page copy. Keep that limit attached to every conversion.
| Form | Calculation or page wording | What it represents |
|---|---|---|
| Rate | 13 cases per 1,000 people | The source page’s historical, all-population U.S. rate; survey sample size not stated. |
| Percentage | 13 ÷ 1,000 × 100 = 1.30% | The same 13-per-1,000 rate expressed as a percentage. |
| One-in form from the rate | 1,000 ÷ 13 = 76.923; about 1 in 77 | The reciprocal of the displayed rate, rounded to a whole person. |
| One-in form printed by the page | “About 1 in 76” | The page’s approximate wording; it is not the exact reciprocal of 13 per 1,000. |
| Count printed by the page | “About 3.5 million people in the USA” | The page’s approximate count; its population base is not stated. |
Why “1 in 76” is not the exact reciprocal
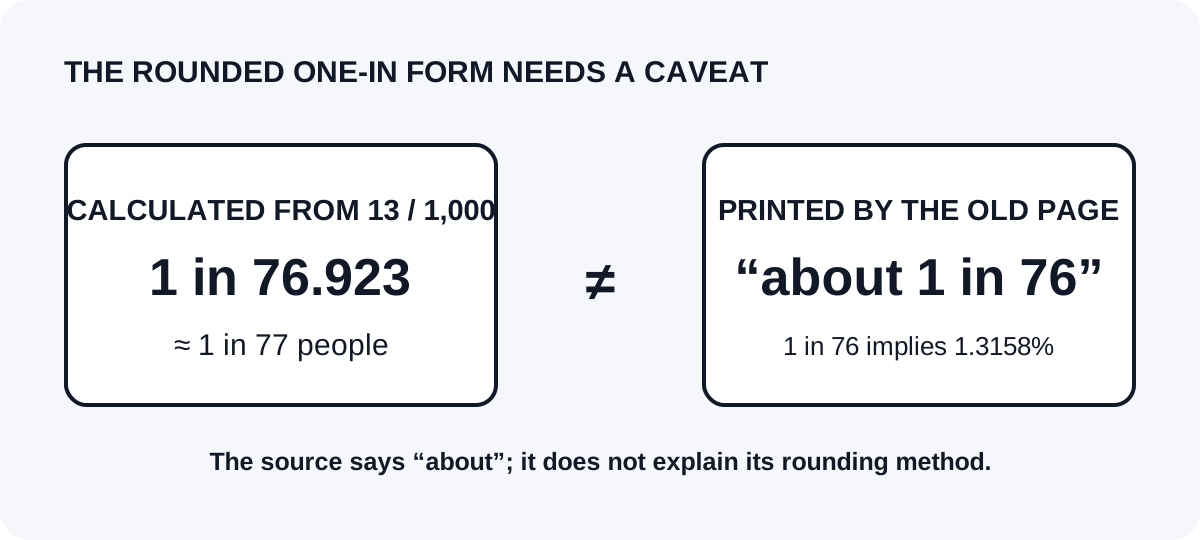
Dividing the stated denominator, 1,000 people, by the 13 cases gives 76.923 people per case. Rounded to the nearest whole-person denominator, that is about 1 in 77. The archived page instead says “about 1 in 76.”
Those two forms are close, but not identical. At exactly 1 in 76, the implied rate is 1.3158%, while 13 per 1,000 is 1.30%. The source uses “about,” but it does not explain whether the difference came from truncation, an earlier unrounded value, or another calculation. Keep the discrepancy visible instead of silently making the figures agree.
What the 3.5 million estimate implies—and what it cannot prove
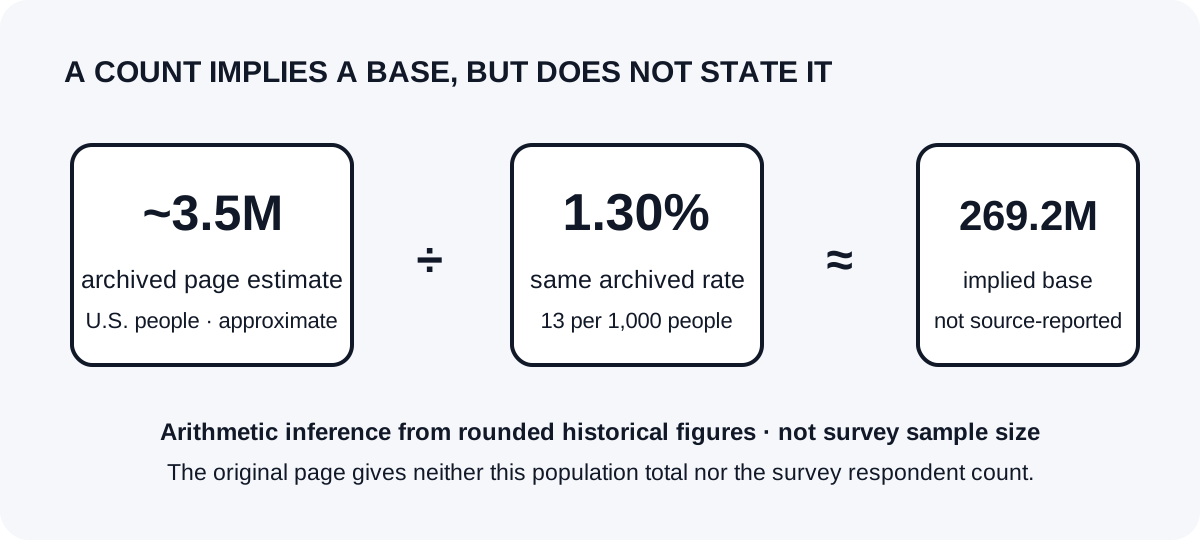
If the page’s approximate 3.5 million count was produced by applying 1.30% to a U.S. population total, the implied base is 3.5 million ÷ 0.013, or about 269.2 million people. This is an arithmetic inference from the archived page’s own rounded figures, not a population count reported by the page.
The implied base is not the survey denominator. A population total used to expand a rate and the number of people examined in a survey answer different questions. The recovered record gives “per 1,000,” but it does not give the sample size, the population total used for the 3.5 million estimate, or the exact calculation date. The implied 269.2 million therefore cannot be treated as a verified 1995 U.S. population figure.
Two archived pages do not make two independent measurements
A 2004 statistics page and a 2011 prevalence page carry the same “13 per 1,000 — NHIS95” label and the same approximate conversions. Their matching text shows that the figure was repeated on the same site; it does not independently verify the underlying survey or its denominator.
The “95” in the source label is presented here only as part of the page’s label. The underlying NHIS report was not present in the recovered material, so this guide does not claim to have checked its methods, sample, or field dates.
A safe way to quote the record
Write the rate with its date label, geography, and denominator wording. Preserve the source’s rounded headcount as an attributed historical estimate, and say when the population base or sample size is missing. If a comparison requires a verified present-day total, use a newer source that reports its own year and population basis instead of carrying this historical count forward.