Protanomaly: What It Is and How It Differs from Protanopia
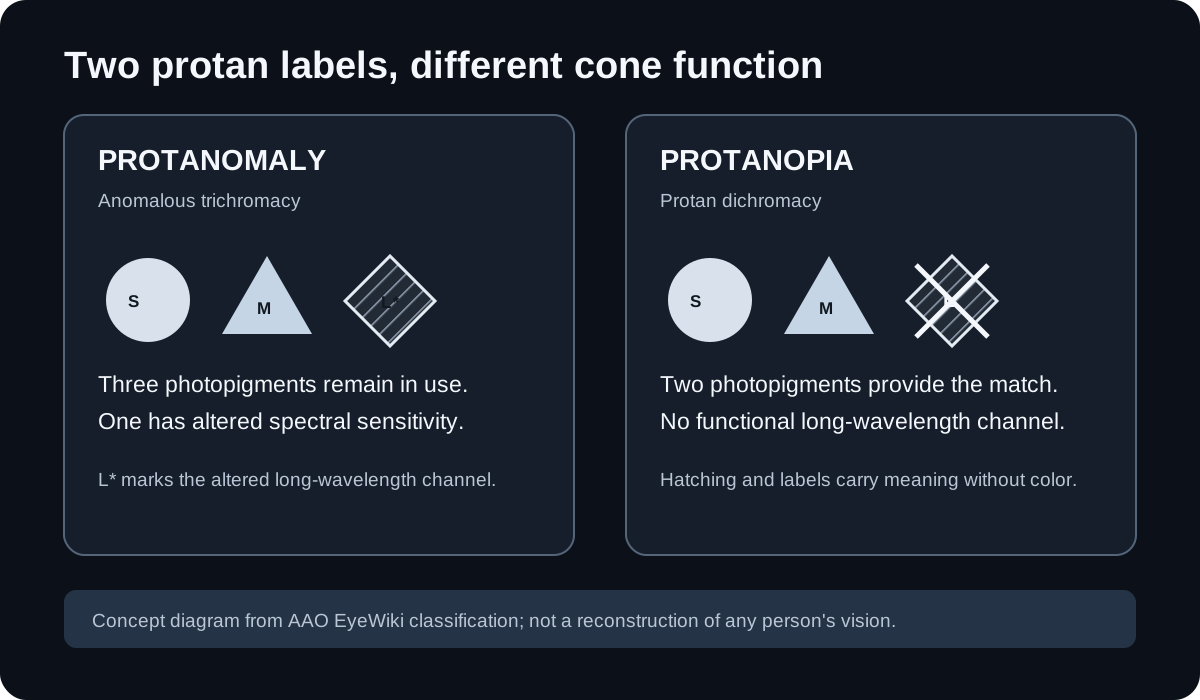
Protanomaly is an inherited red–green color-vision deficiency in which some shades of red may look greener and less bright. People with the inherited form have an altered red-sensitive cone photopigment while retaining three cone photopigments. Protanopia is a protan dichromacy with one cone photopigment absent or nonfunctional; protanomaly retains three, with one altered. National Eye Institute overview · American Academy of Ophthalmology EyeWiki.
To review a design, compare one image in the Protan view, note which task-relevant marks become hard to separate, add a text, shape, pattern, or position cue, then repeat with the same image and settings. This simulator previews an image; it does not identify or diagnose a person's vision.
What changes in protanomaly
Protanomaly is a form of anomalous trichromacy: three cone photopigments remain in use, but one has an altered spectral sensitivity. The National Eye Institute describes some reds as looking greener and less bright. That describes a general type, not a prediction of exactly how one individual sees every scene. NEI, “Types of Color Vision Deficiency” · AAO EyeWiki, “Color Vision”.
Protanopia is a different protan type: it is dichromatic, with one cone photopigment absent or without function. The two names are not interchangeable. A color simulator cannot determine which type a person has; that requires a vision assessment.
Use the simulator to check one design image
Keep the task, source image, and simulation settings fixed so another person can repeat the review. The tool accepts one JPEG, PNG, or WebP image at a time and processes it in the browser.
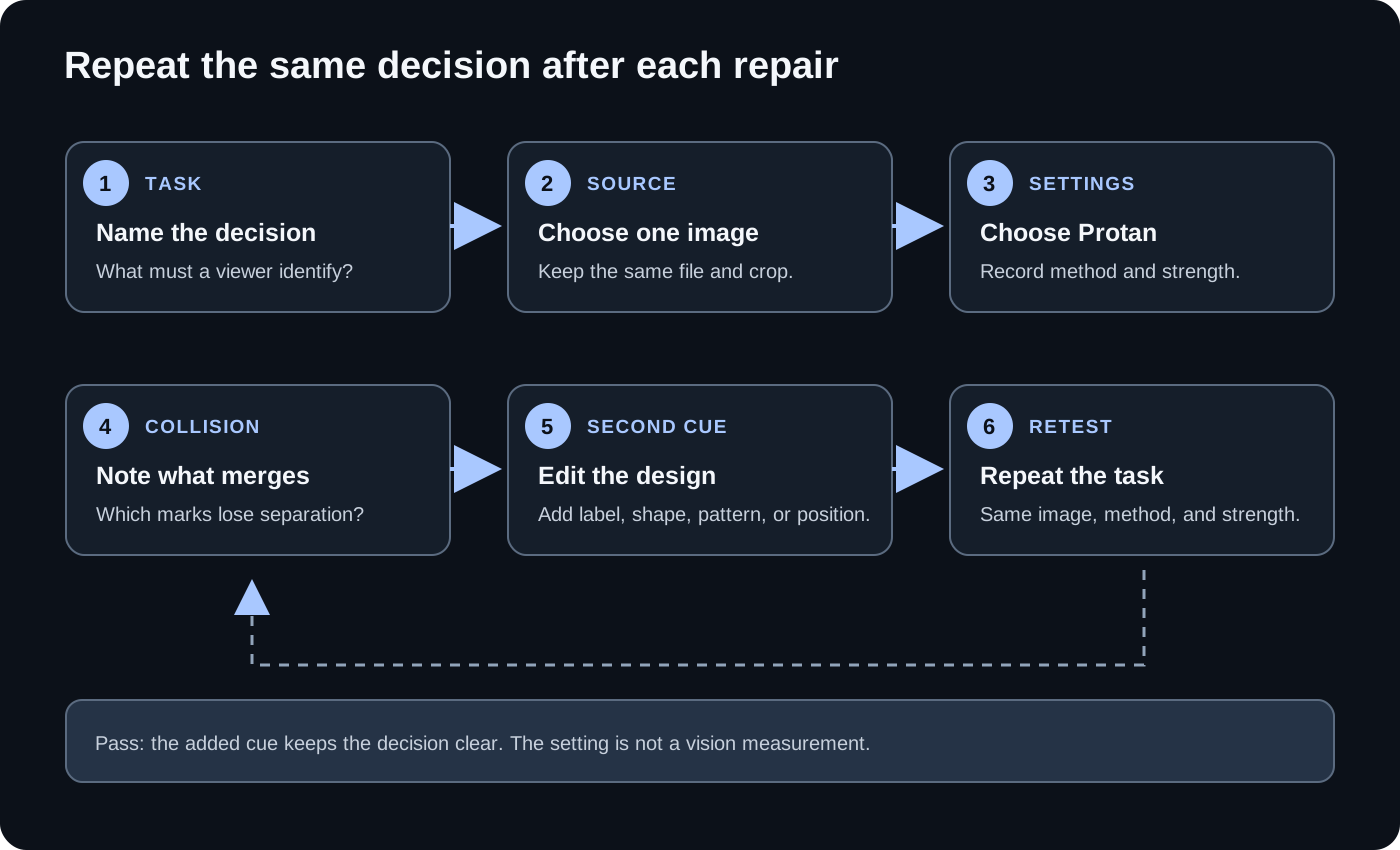
- Name the task. Write down what a viewer must decide, such as which status needs attention or which chart line to follow.
- Choose the image. Load the exact screen, chart, map, or photo containing that task. Keep the same crop throughout the review.
- Set the view. Select Protan, choose a method (Brettel 1997, Viénot 1999, Machado 2009, or DeficiencyView), and record the simulation-strength setting. These are model controls, not a measurement of anyone's eyesight.
- Find the collision. Compare Original, Simulated, and Difference. Record the task-relevant labels, marks, or boundaries that become difficult to distinguish in the simulated view.
- Add a second cue and retest. Change the source design to add a direct label, shape, pattern, border, or position cue. Load the updated image and repeat the same task with the same method and strength.
Record: task → image and crop → Protan method and strength → what became hard to distinguish → second cue added → result on the repeated task. The grayscale Difference panel is auto-scaled for each result; it is not a score of the person's vision.
A second cue makes the status decision explicit
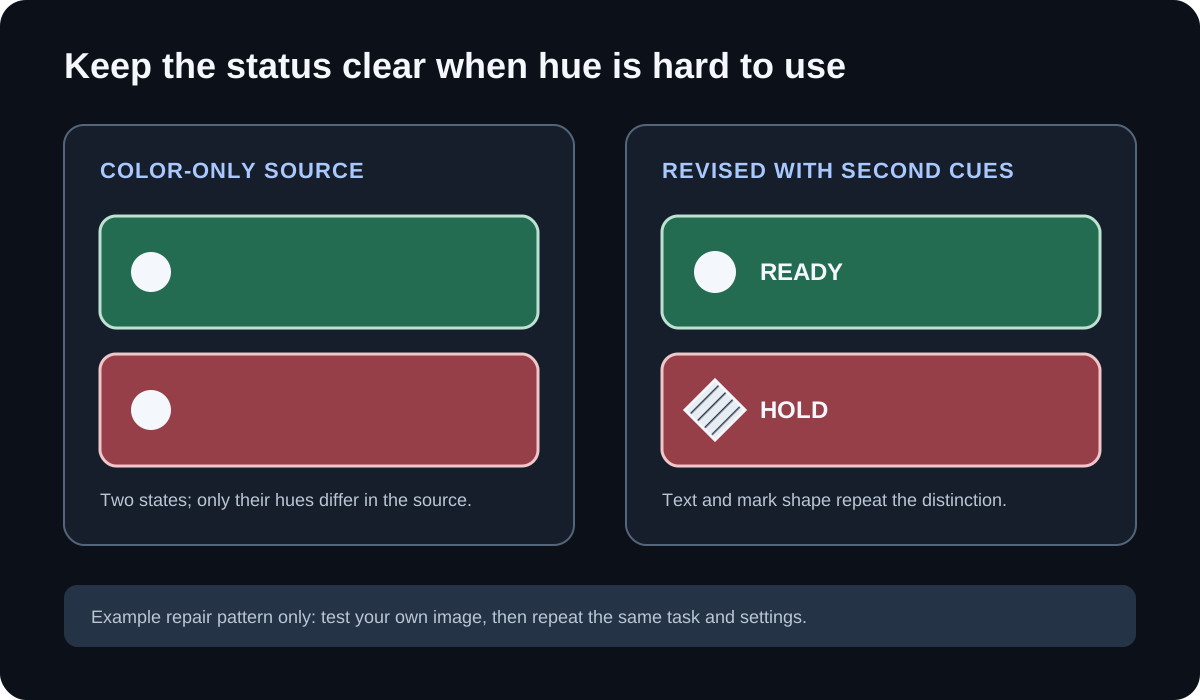
For a color-coded status row, first check whether the task can be completed when color is the only signal. If “ready” and “hold” become hard to tell apart, add a word and a distinct mark to each state. Then reload that edited source and repeat the same status decision. The labels and marks carry the meaning if the hues are difficult to separate.
This is a design-review example, not a claim that a generated preview reproduces any one person's sight.
What “mild” and “moderate” mean depends on the test
The National Eye Institute describes protanomaly as a mild type that usually does not interfere with normal activities. That general description is not a personal numeric grade. If a report uses “mild” or “moderate,” keep the test name, section, score format, and denominator beside its label before comparing it with another report.
The cited table: WCCVT Table 1, Protan section
The cited study's Table 1 labels its Protan section as a deficiency score. It records correct answers from the study's 32 diagnostic plates:
| Correct answers out of 32 | Table 1 label |
|---|---|
| 15–32 | Mild |
| 4–14 | Moderate |
| 0–3 | Severe |
WCCVT Table 1 records the number correct in 32 diagnostic plates, and these bands apply only to the test protocol used in that study. The table's heading is “protan deficiency”; it does not say that these values are a universal congenital protanomaly scale. Read the full study and Table 1 at PubMed Central.
Study population and limits
The study examined people with relapsing-remitting multiple sclerosis (RRMS) and excluded participants who self-reported congenital color blindness. It was published online on November 29, 2025, and appeared in the 2026 volume of European Neurology (full study). The authors' population and test protocol limit what the labels establish.
The study does not establish that its Protan deficiency bands classify congenital protanomaly, apply to a different plate set, or predict everyday color experience. The exact mild, moderate, and severe ranges above belong to this WCCVT protocol alone.
Frequently asked questions
What does mild protanomaly mean?
The National Eye Institute describes protanomaly generally as mild and says it usually does not interfere with normal activities. That wording is not a personal score; a test label only makes sense with the test and scoring protocol attached.
What can protanomaly vision look like?
The NEI says some shades of red may look greener and less bright. A simulator shows one model applied to an image, not an individual's complete or exact visual experience.
Do protanomaly glasses work?
They should not be expected to restore typical color vision or replace an assessment. The AAO EyeWiki review describes mixed study findings and notes that filters may help distinguish some colors at the expense of others. Ask an eye-care professional about an assessment if the distinction matters for you. AAO EyeWiki · 2022 systematic review of color-vision devices.
Does moderate protanomaly have one standard score?
This page does not establish a universal moderate score. The WCCVT values shown here are labels from one RRMS study's 32-plate protocol; use the named test's own interpretation for any other result.
Why an FM 100-Hue score cannot replace the WCCVT bands
A Farnsworth–Munsell 100-Hue total error score (TES) does not directly correspond to color-deficiency severity. A 2024 validation paper states that there is no direct correlation between its error score and color-vision-defect severity, so TES cannot replace the WCCVT plate count or be converted with Table 1. Read the 2024 validation study.
Sources and scope
- National Eye Institute, “Types of Color Vision Deficiency,” last updated August 7, 2023. Source page.
- American Academy of Ophthalmology EyeWiki, “Color Vision.” Source page.
- “Digital Color Vision Testing Reveals Widespread Cone Dysfunction in Multiple Sclerosis Independent of Optic Neuritis,” European Neurology, 89(1), 13–21 (2026; published online November 29, 2025), Table 1, “Scoring and severity grading of CVD.” Full text at PubMed Central.
- “Validation of a New Digital and Automated Color Perception Test,” Diagnostics, 14(4):396 (2024), discussion of FM 100-Hue TES and severity. Full text at PubMed Central.
- “Color vision devices for color vision deficiency patients: A systematic review and meta-analysis,” Health Science Reports (2022). Full text at PubMed Central.
The cited sources support the definition, study-table reading, and stated limits. They do not establish a universal protanomaly score.